-
未登录
热门文章
在我们的图表旁边一般都看不到大量的文字内容展示,大量的文字展示不仅会影响美观性,而且还容易破坏图表的内容布局。那当我们要展示某一个点的数据信息时又该如何做呢?不用担心,ECharts 已经帮我们准备好了,让我们在不影响整体简洁图表的美观性,又能看到某一处的相信数据信息。下面我们一起去了解一下 ECharts 中提示框是如何使用的吧。
官方定义:
提示框组件。
xx解释
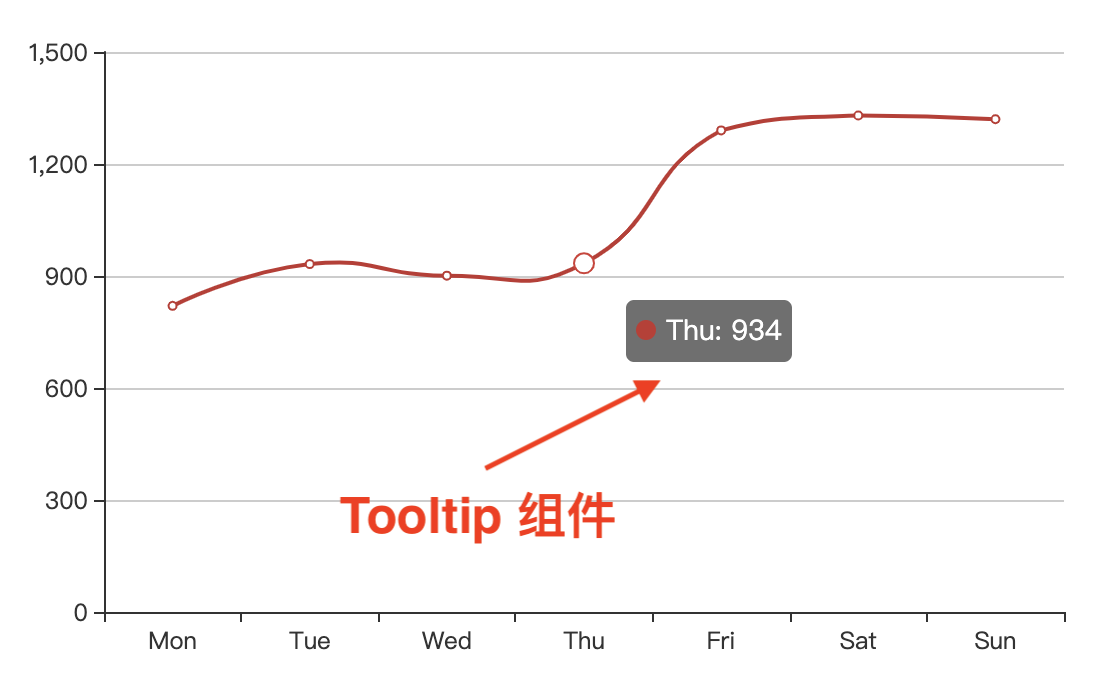
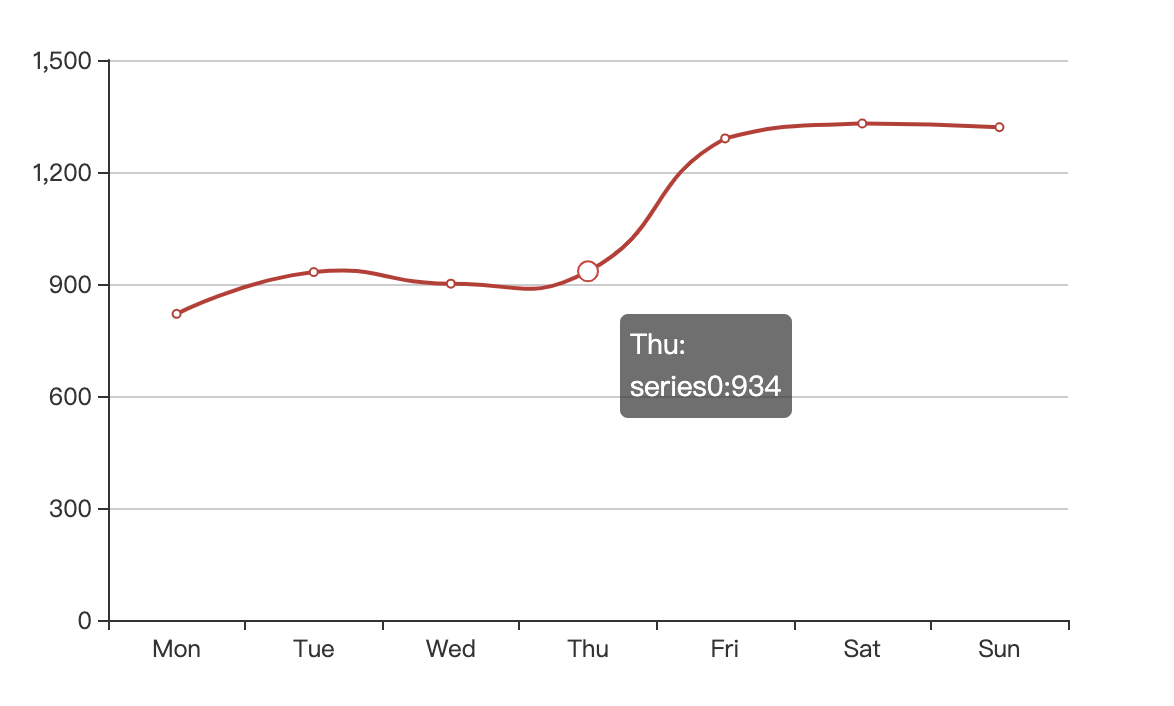
提示框指当鼠标悬停在图表的某点或坐标轴的某个值上时,以浮层形式展示该点数据信息的组件。例如:
tooltip 组件使用范围较大,首先可以在图表的多个层级配置:
Tips:
ECharts 会沿配置链路逐级向上 merge,计算出最终作用在数据项上的配置值。
其次,部分辅助组件也支持 tooltip 功能,包括:
tooltip 支持的配置项在 官网 上有详细罗列,此处不赘述。本文将更多关注提示框组件常规的用例场景,以实例方式展示使用方法。
启动 tooltip 组件,最简单的方法是在实例级别上配置 tooltip 属性,例如:
<!DOCTYPE html>
<html lang="zh-CN">
	<head>
		<meta charset="utf-8" />
		<meta http-equiv="X-UA-Compatible" content="IE=edge" />
		<meta name="viewport" content="width=device-width,initial-scale=1.0" />
		<title>Echarts Example</title>
	</head>
	<body>
		<div id="main" style="width: 600px;height: 400px"></div>

		<script src="//cdn.bootcss.com/echarts/4.5.0/echarts.js"></script>
		<script type="text/javascript"> const myChart = echarts.init(document.getElementById('main')); const option = { xAxis: { type: 'category', data: ['Mon', 'Tue', 'Wed', 'Thu', 'Fri', 'Sat', 'Sun'], }, yAxis: { type: 'value' }, tooltip: { show: true }, series: [ { data: [820, 932, 901, 934, 1290, 1330, 1320], type: 'line', smooth: true, }, ], }; myChart.setOption(option); </script>
	</body>
</html>
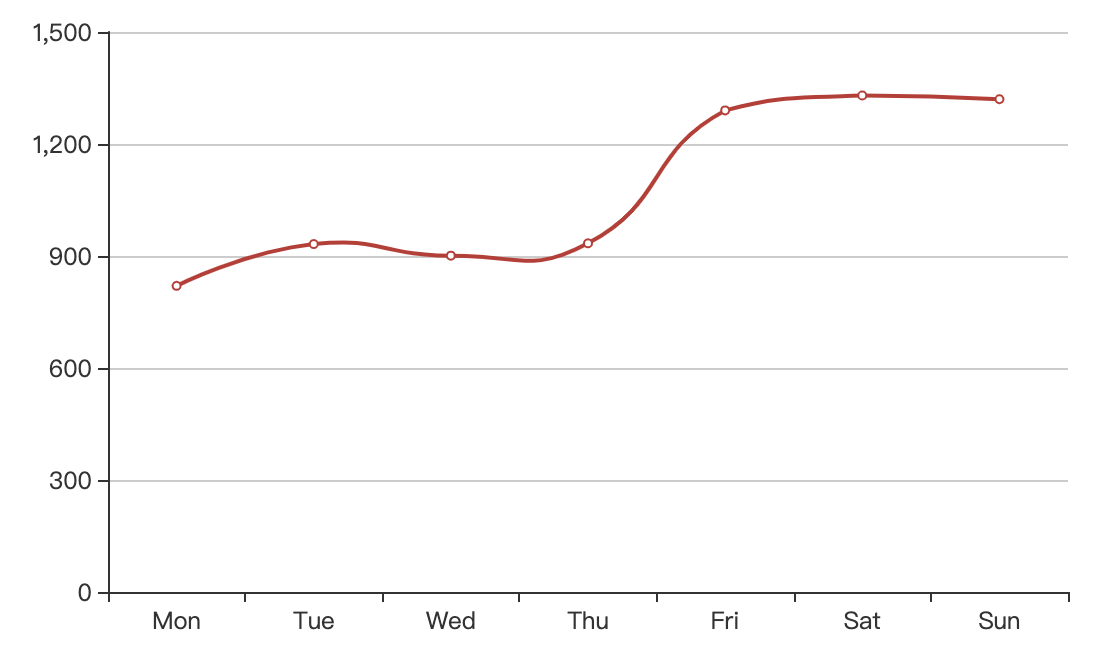
实例中,配置对象 option 配置有根属性 tooltip: { show: true }即可在所有图表上开启提示框功能,示例效果:
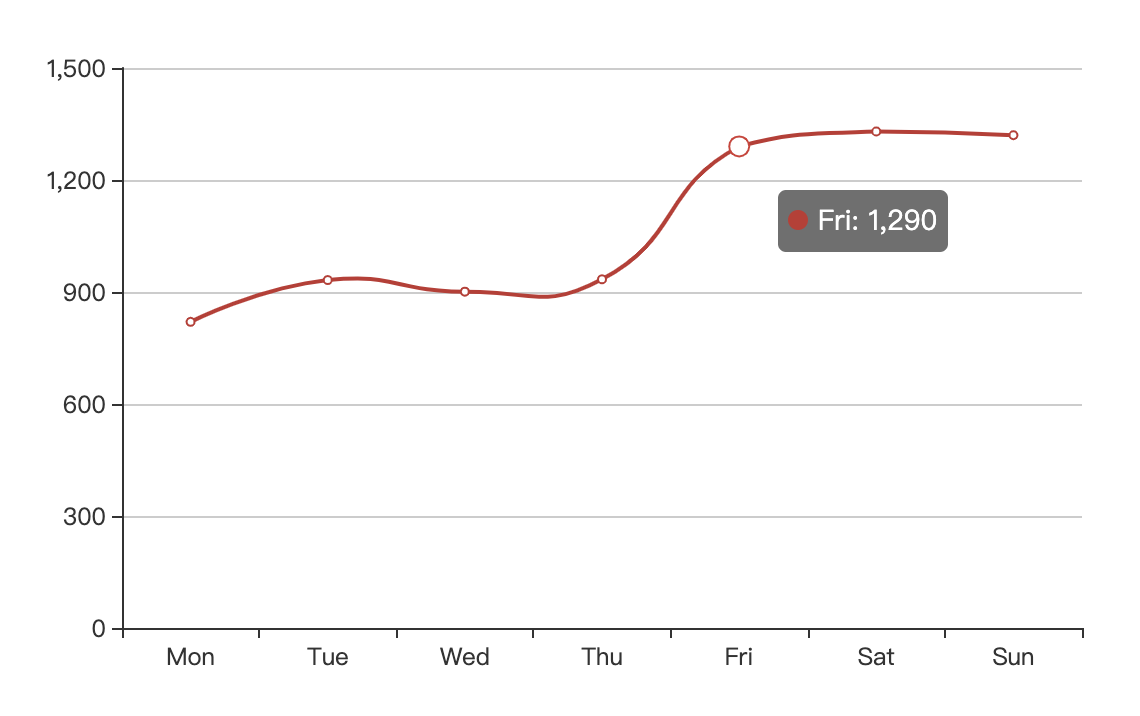
图表上的 tooltip 默认触发类型为 item,即鼠标悬停在数据项上时触发,且提示框紧跟在数据项附近。可通过 trigger 属性修改触发方式,支持如下值:
首先看看 item 示例:
<!DOCTYPE html>
<html lang="zh-CN">
	<head>
		<meta charset="utf-8" />
		<meta http-equiv="X-UA-Compatible" content="IE=edge" />
		<meta name="viewport" content="width=device-width,initial-scale=1.0" />
		<title>Echarts Example</title>
	</head>
	<body>
		<div id="main" style="width: 600px;height: 400px"></div>

		<script src="//cdn.bootcss.com/echarts/4.5.0/echarts.js"></script>
		<script type="text/javascript"> const myChart = echarts.init(document.getElementById('main')); const option = { xAxis: { type: 'category', data: ['Mon', 'Tue', 'Wed', 'Thu', 'Fri', 'Sat', 'Sun'], }, yAxis: { type: 'value' }, tooltip: { show: true }, series: [ { data: [820, 932, 901, 934, 1290, 1330, 1320], type: 'line', smooth: true, }, ], }; myChart.setOption(option); </script>
	</body>
</html>
示例效果:
上例基础上,修改 tooltip 为:
tooltip: {
  show: true,
  // 设定为按坐标轴触发
  trigger: 'axis',
},
示例效果:
Tips:
axis 模式在直角坐标系、极坐标系下的所有图表均有效,且可以通过 tooltip.axisPointer.axis 属性指定触发的坐标轴。其他坐标系图表只能支持 item或 none 触发。
默认情况下,tooltip 在鼠标悬停时触发,可以通过 tooltip.triggerOn配置项修改触发条件,接受如下值:
当 tooltip.triggerOn值为 none 时,可通过 Action 交互 接口控制提示框:
tooltip.showTip(https://www.echartsjs.com/zh/api.html#action.tooltip.showTip) 显示提示框,用法:echartInstance.dispatchAction({
type: 'showTip',
// 系列的 index
seriesIndex?: number,
// 数据的 index
dataIndex?: number,
// 可选,数据名称,在有 dataIndex 的时候忽略
name?: string,
// 本次显示 tooltip 的位置。只在本次 action 中生效。
// 缺省则使用 option 中定义的 tooltip 位置。
position: Array.<number>|string|Function,
})
tooltip.hideTip(https://www.echartsjs.com/zh/api.html#action.tooltip.hideTip) 隐藏提示框,用法:dispatchAction({
type: 'hideTip',
});
综合示例:
<!DOCTYPE html>
<html lang="zh-CN">
	<head>
		<meta charset="utf-8" />
		<meta http-equiv="X-UA-Compatible" content="IE=edge" />
		<meta name="viewport" content="width=device-width,initial-scale=1.0" />
		<title>Echarts Example</title>
	</head>
	<body>
		<div id="main" style="width: 600px;height: 400px"></div>

		<script src="//cdn.bootcss.com/echarts/4.5.0/echarts.js"></script>
		<script type="text/javascript"> const myChart = echarts.init(document.getElementById('main')); const data = [820, 932, 901, 934, 1290, 1330, 1320]; const option = { xAxis: { type: 'category', data: ['Mon', 'Tue', 'Wed', 'Thu', 'Fri', 'Sat', 'Sun'], }, yAxis: { type: 'value' }, tooltip: { show: true, trigger: 'item', }, series: [ { data: data, type: 'line', smooth: true, }, ], }; myChart.setOption(option); const len = data.length; (function triggerTooltip(index) { myChart.dispatchAction({ type: 'showTip', seriesIndex: 0, dataIndex: index % len }); setTimeout(() => triggerTooltip(index + 1), 500); })(0); </script>
	</body>
</html>
运行效果:
Tips:
tooltip.showTip行为是鼠标交互的替换方式,效果与鼠标触发一模一样,这背后有两层含义,一是无论调用多少次,当前只会有一个提示框被激活。例如上例中并没有调用tooltip.hideTip行为,当每次tooltip.showTip之后都会自动把前一个提示框隐藏掉。二是,接口触发与鼠标交互触发相互冲突,比如上例运行过程中,如果鼠标悬停在数据项上,效果:
这一点可能导致图表效果比较混乱,应用时务必注意。
tooltip 组件的核心作用是展示数据项相关的信息,提示内容可以通过 tooltip.formatter项进行配置。tooltip.formatter接受模板字符串、模板函数两种类型的值:
模板字符串行人如 {a}: <br />{c}其中 {}为 echarts 提供的模板变量,不同图表所提供的变量集合不同,但通常有:
更多信息可参考 官网解释。
模板字符串支持传入 html 标签,这在 tooltip.renderModel = html时会被渲染为标准的 DOM 结构,例如:
<!DOCTYPE html>
<html lang="zh-CN">
	<head>
		<meta charset="utf-8" />
		<meta http-equiv="X-UA-Compatible" content="IE=edge" />
		<meta name="viewport" content="width=device-width,initial-scale=1.0" />
		<title>Echarts Example</title>
	</head>
	<body>
		<div id="main" style="width: 600px;height: 400px"></div>

		<script src="//cdn.bootcss.com/echarts/4.5.0/echarts.js"></script>
		<script type="text/javascript"> const myChart = echarts.init(document.getElementById('main')); const option = { xAxis: { type: 'category', data: ['Mon', 'Tue', 'Wed', 'Thu', 'Fri', 'Sat', 'Sun'], }, yAxis: { type: 'value' }, tooltip: { show: true, trigger: 'item', // 定义提示框内容 formatter: 'Data Item:<br /> {b}: <strong>{c}</strong>', }, series: [ { data: [820, 932, 901, 934, 1290, 1330, 1320], type: 'line', smooth: true, }, ], }; myChart.setOption(option); </script>
	</body>
</html>
示例中设定提示框的格式为 'Data Item:<br /> {b0}: <strong>{c0}</strong>'渲染结果:
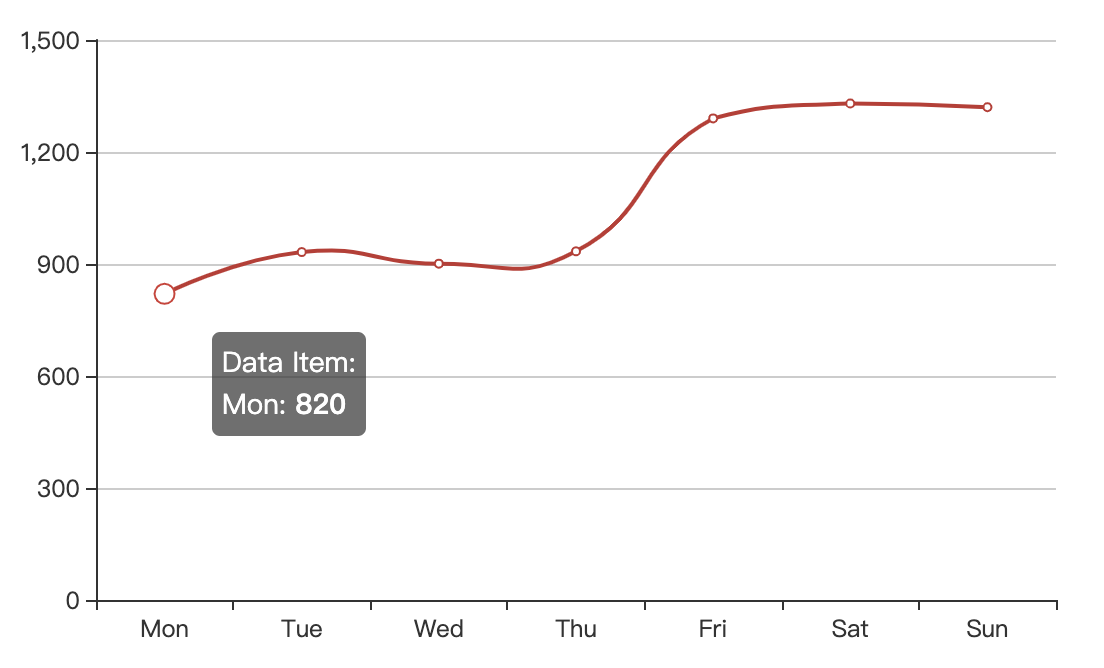
Tips:
模板字符串存在一些明显的缺陷:
- 功能单一,只实现了变量替换功能,格式化时只能沿用 echarts 所提供的变量集合,不能做进一步计算,即使是很简单的百分比格式化也无法实现;
- 变量的类型、数量、顺序与 tooltip 所在位置强相关,模板与图表强耦合,若实际应用中变更了图表类型,可能导致模板失效;
- 变量名均为 a、b、c 等没有语义的字符,这在某种程度上增加了记忆强度;
- 格式化文本在不同渲染模式下可能渲染出不同的效果,详见 2.5 控制提示框渲染方式 一节。
模板字符串实现的非常鸡肋,无法承担较复杂的格式化需求,建议尽量使用模板函数方式。
当图表上有多个数据序列,传入的变量名会出现有点变化,例如 :
例如下例中:
<!DOCTYPE html>
<html lang="zh-CN">
<head>
<meta charset="utf-8" />
<meta http-equiv="X-UA-Compatible" content="IE=edge" />
<meta name="viewport" content="width=device-width,initial-scale=1.0" />
<title>Echarts Example</title>
</head>
<body>
<div id="main" style="width: 600px;height: 400px"></div>
<script src="//cdn.bootcss.com/echarts/4.5.0/echarts.js"></script>
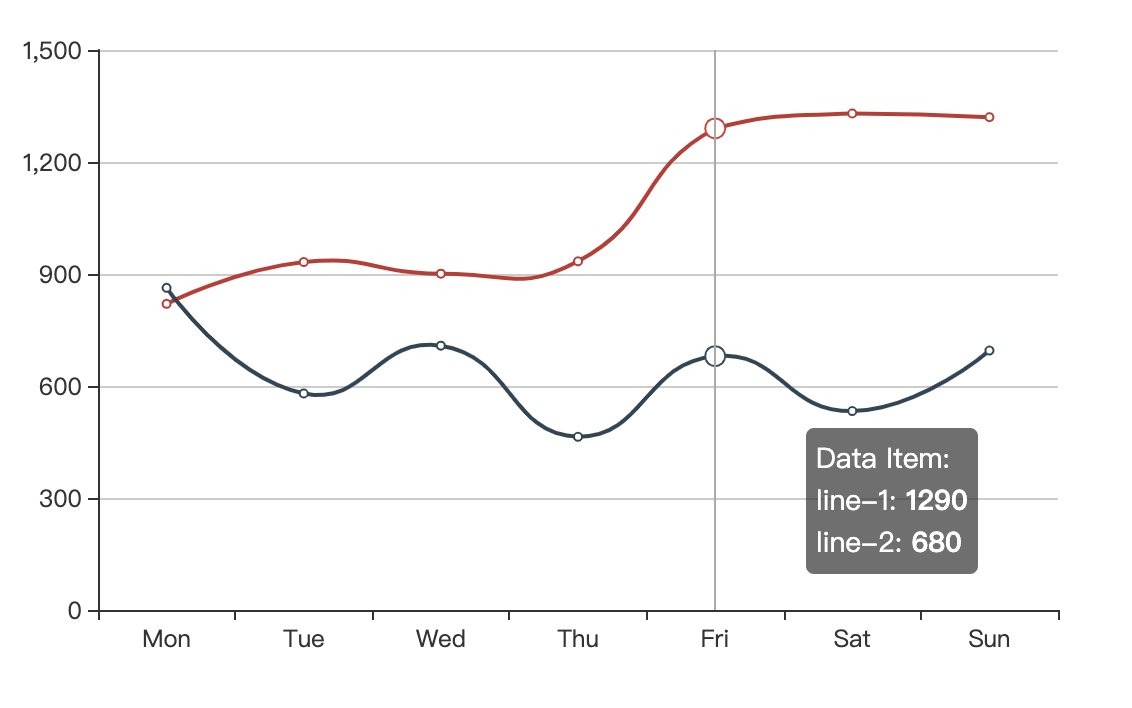
<script type="text/javascript"> const myChart = echarts.init(document.getElementById('main')); const option = { xAxis: { type: 'category', data: ['Mon', 'Tue', 'Wed', 'Thu', 'Fri', 'Sat', 'Sun'], }, yAxis: { type: 'value' }, tooltip: { show: true, trigger: 'axis', // 定义提示框内容 formatter: 'Data Item:<br /> {a0}: <strong>{c0}</strong> <br /> {a1}: <strong>{c1}</strong>', }, series: [ { data: [820, 932, 901, 934, 1290, 1330, 1320], type: 'line', name: 'line-1', smooth: true, }, { data: [863, 580, 708, 464, 680, 533, 695], type: 'line', name: 'line-2', smooth: true, }, ], }; myChart.setOption(option); </script>
</body>
</html>
示例包含两个折线图,此时 tooltip.formatter为 'Data Item:<br /> {a0}: <strong>{c0}</strong> <br /> {a1}: <strong>{c1}</strong>'指定了 a0、a1 等变量,渲染结果:
tooltip.formatter还支持传入函数值,签名形如:
(params: Object|Array, ticket: string, callback: (ticket: string, html: string)) => string
Tips:
模板函数需返回字符串值,与模板字符串相似,若渲染模式tooltip.renderMode = html则字符串中支持 html 标签。
其中包含参数:
params 形态不定,根据触发方式、图表类型会有些差异,但通常包含如下属性:
{
    componentType: 'series',
		// 系列类型,如 line、pie、bar
    seriesType: string,
    // 系列在传入的 option.series 中的 index
    seriesIndex: number,
    // 系列名称
    seriesName: string,
    // 数据名,类目名
    name: string,
    // 数据在传入的 data 数组中的 index
    dataIndex: number,
    // 传入的原始数据项
    data: number|Array|Object,
    // 传入的数据值。在多数系列下它和 data 相同。在一些系列下是 data 中的分量(如 map、radar 中)
    value: number|Array|Object,
		// 坐标轴 encode 编码方式
    encode: Object,
    // 维度名列表
    dimensionNames: Array<String>,
    // 数据的维度 index,如 0 或 1 或 2 ...
    // 仅在雷达图中使用。
    dimensionIndex: number,
    // 数据图形的颜色
    color: string,
    // 饼图的百分比
    percent: number,
}
示例:
<!DOCTYPE html>
<html lang="zh-CN">
	<head>
		<meta charset="utf-8" />
		<meta http-equiv="X-UA-Compatible" content="IE=edge" />
		<meta name="viewport" content="width=device-width,initial-scale=1.0" />
		<title>Echarts Example</title>
	</head>
	<body>
		<div id="main" style="width: 600px;height: 400px"></div>

		<script src="//cdn.bootcss.com/echarts/4.5.0/echarts.js"></script>
		<script type="text/javascript"> const myChart = echarts.init(document.getElementById('main')); const option = { xAxis: { type: 'category', data: ['Mon', 'Tue', 'Wed', 'Thu', 'Fri', 'Sat', 'Sun'], }, yAxis: { type: 'value' }, tooltip: { show: true, trigger: 'item', // 定义提示框内容 formatter(params) { const { seriesName, name, data } = params; return `${name}: <br />${seriesName}:${data}`; }, }, series: [ { data: [820, 932, 901, 934, 1290, 1330, 1320], type: 'line', smooth: true, }, ], }; myChart.setOption(option); </script>
	</body>
</html>
示例效果:
Tips:
params 参数的值与提示框所在位置强相关,建议开发时使用 debugger、console.dir 等手段进一步确认。
模板函数支持异步形式,需要配合使用 ticket、callback 两个参数,在上例基础上,修改 tooltip 配置:
formatter(params, ticket, cb) {
	// 执行异步操作
	setTimeout(() => {
		// 异步操作完成后,需调用 cb 回调
		// 传入 ticket 及提示内容字符串
		cb(ticket, 'Async Success');
	}, 1000);
	// 立即返回过渡态的提示内容
	return 'Loading';
},
其中,ticket 为 ECharts 内部令牌,无需关注;callback 为异步回调函数,示例效果:
Tips:
模板函数在每次激活提示框时都会被触发,ECharts 没有对函数的执行做任何性能优化,这可能导致:
- 如果模板函数的执行时间长,会导致页面卡顿,影响交互效果。
- 如果模板函数包含了异步操作,比如调用 ajax 接口,则接口会随提示框的激活而多次被调用。
与提示框渲染方式有关的配置项包括:
| 配置名 | 类型 | 默认值 | 说明 |
|---|---|---|---|
| renderMode | string | html | 指定渲染模式,支持 html、richText |
| extraCssText | string | 附加在提示浮层的样式,仅当 renderMode = html时有效 |
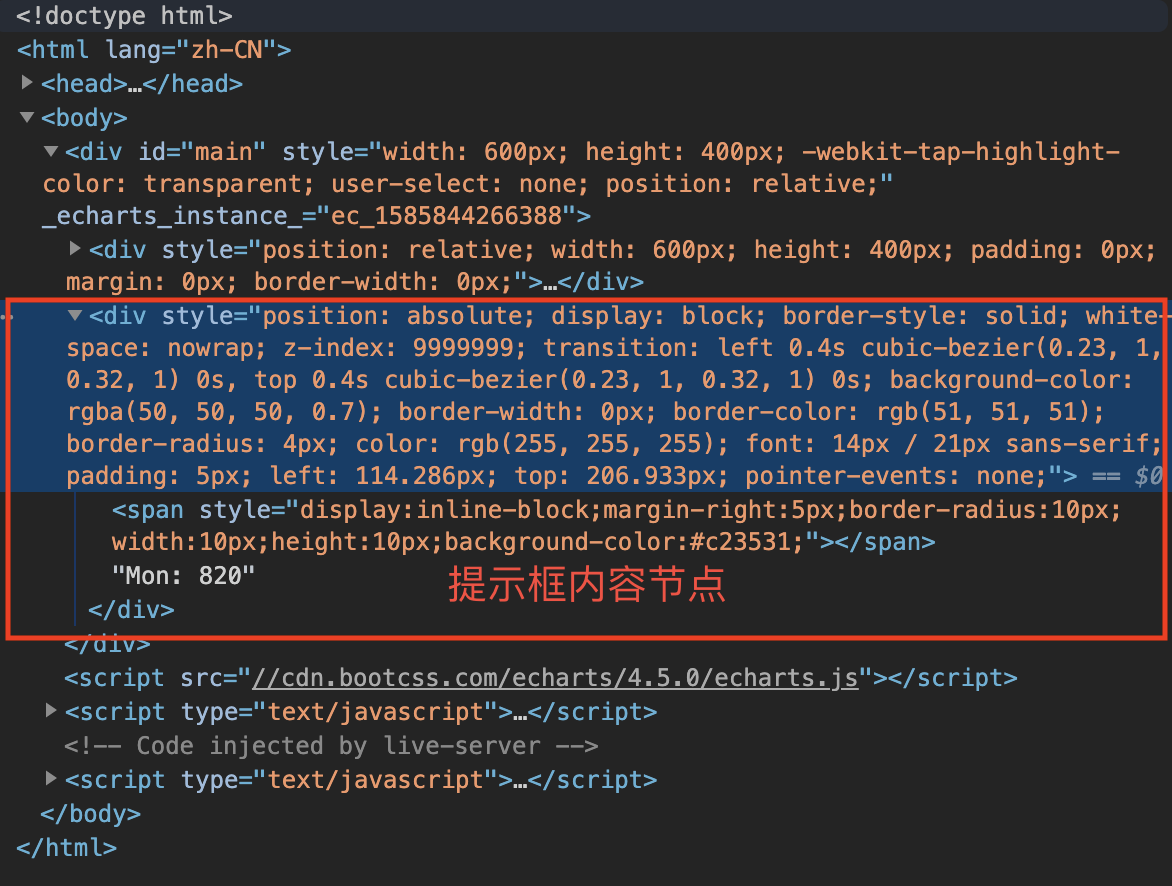
renderMode 用于指定提示框的渲染模式。当 renderMode = html时,提示框会以 DOM 形式追加到图表容器节点的后面,结果如:
此时可以使用 extraCssText 为提示浮层增加更多样式,extraCssText 属性与 html 标签的 style 属性一样,接受 ;分割的 CSS 值,如:extraCssText: 'box-shadow: 0 0 3px rgba(0, 0, 0, 0.3);'
Tips:
在官方文档中有提及另外一个属性:appendToBody,用于指定当renderMode = html时,提示框的 DOM 是否追加到<body>节点下,但实测无效,无论如何设置,渲染出的结果都只会追加到图表容器节点上。
当 renderMode = richText时,内容将渲染在 canvas 上(SVG 模式目前还不支持),关于 richText的更多介绍,可参考 Echarts 富文本样式 一节。 html 与 richText 模式的主要区别有:
formatter: 'Data Item:<br /> {b0}: {c0}'渲染效果的差异: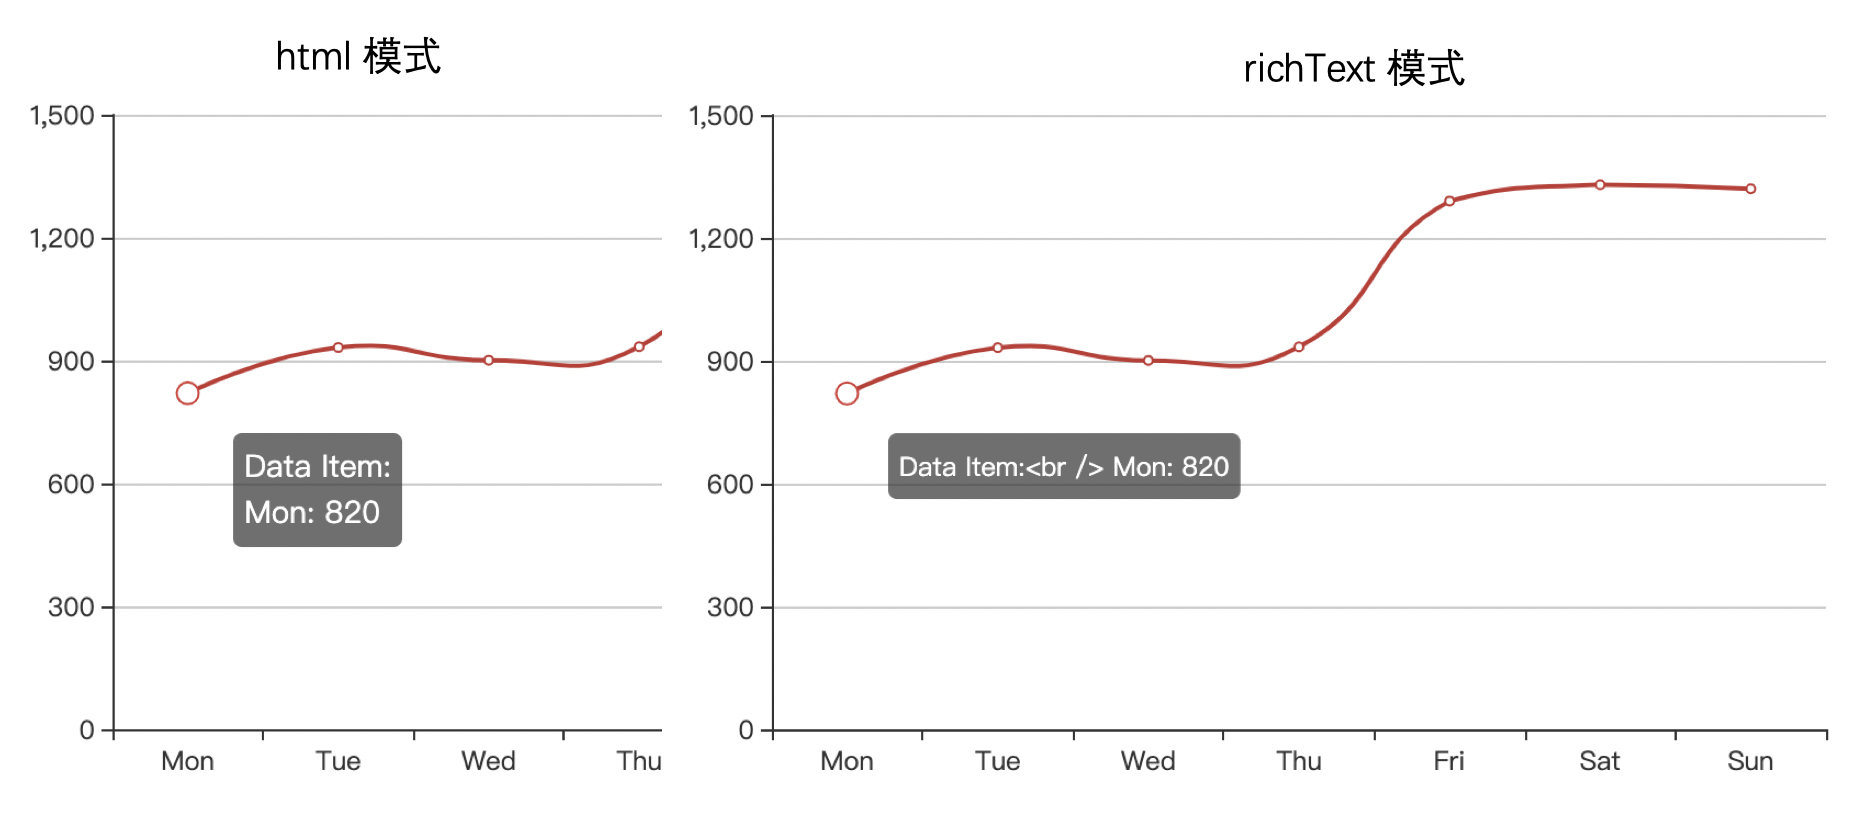
Tips:
html 模式与普通的页面开发方法相似,更容易通过浏览器的 debugger 工具调试,所以个人更推荐使用 html 模式。canvas 则可应对一些没有 DOM 的环境,例如小程序中。
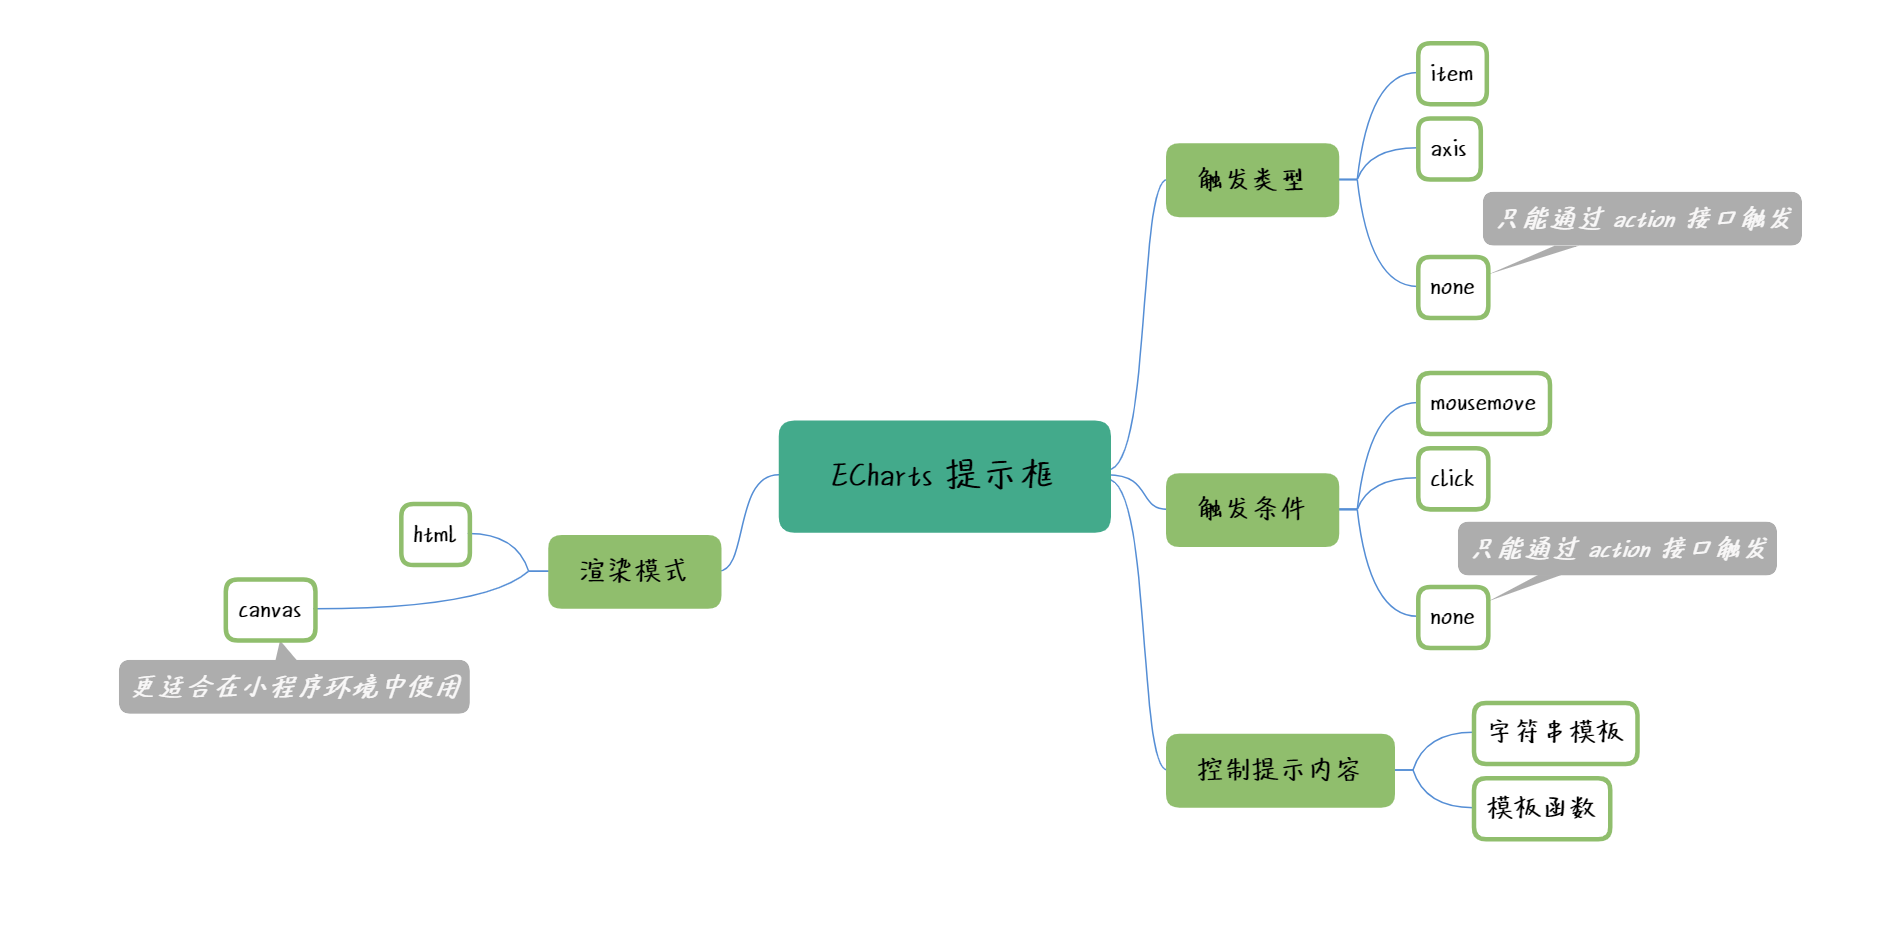
本节结合实例,讲述 Echarts 中提示框组件(Tooltip)的各类功能特性,包括基础配置方法;支持的触发类型、触发条件;如何通过模板字符串、函数方式修改提示框内容;提示框组件支持的渲染模式等。