-
未登录
热门文章
在《ECharts 文本样式》小节,我们学习了如何对图表中的文本样式进行美化,需要美化的内容不只是文本,在我们图表中还有其他的内容需要我们用样式美化,以便于能更好的观察数据以及数据的变化,比如:为折线图增加一个背景之类的。下面我们就对 ECharts 区域样式内容进行一个解读,当然我们还会通过一些实例来帮助我们理解。
在 ECharts 中,图表、组件最终会被渲染成线段、多边形、文本的集合,多边形在不同组件中虽然被赋予不同的语义,但它们都有相似的表现方法,ECharts 为此提供了一套通用的配置属性集合,称之为区域样式 —— areaStyle。
areaStyle 基类定义在 src/model/mixin/areaStyle.js 文件中,其他组件继承扩展,例如 series-line.areaStyle、radar.splitArea.areaStyle、xAxis.splitArea 等。本文不对具体组件中的定义做过多说明,而侧重于 areaStyle 对象通用的基础功能。
areaStyle 的通用属性包括:
| 配置名 | 类型 | 默认值 | 说明 |
|---|---|---|---|
| color | string|array|object | 区域背景色,支持色值、数组、渐变配置对象,详情请参考 示例 一节 | |
| shadowBlur | number | 0 | 指定区域阴影模糊值大小,需要设置 show 为 true,且 color 不为 transparent 才能生效 |
| shadowColor | string | 阴影颜色值,默认为组件的 color 值 | |
| shadowOffsetX | number | 0 | 阴影的水平偏移量 |
| shadowOffsetY | number | 0 | 阴影的垂直偏移量 |
| opacity | number | 1 | 图形透明度。支持从 0 到 1 的数字,为 0 时不绘制该图形 |
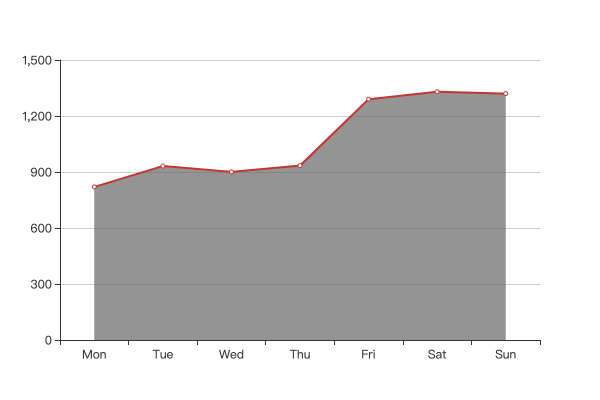
color 属性支持传入色值字符串,格式支持 RGB 如 rgb(255, 255, 255)、RGBA 如 rgb(255, 255, 255, 0.5)、十六进制如 #fff 等,示例:
<!DOCTYPE html>
<html lang="zh-CN">
	<head>
		<meta charset="utf-8" />
		<meta http-equiv="X-UA-Compatible" content="IE=edge" />
		<meta name="viewport" content="width=device-width,initial-scale=1.0" />
		<title>Echarts Example</title>
	</head>
	<body>
		<div id="main" style="width: 600px;height: 400px"></div>

		<script src="//cdn.bootcss.com/echarts/4.5.0/echarts.common.js"></script>
		<script type="text/javascript"> var myChart = echarts.init(document.getElementById('main')); var option = { toolbox: { feature: { saveAsImage: {}, }, }, xAxis: { type: 'category', data: ['Mon', 'Tue', 'Wed', 'Thu', 'Fri', 'Sat', 'Sun'], }, yAxis: { type: 'value' }, series: [ { data: [820, 932, 901, 934, 1290, 1330, 1320], type: 'line', boundaryGap: false, areaStyle: { color: '#666' }, }, ], }; myChart.setOption(option); </script>
	</body>
</html>
示例效果:
此外,color 属性还支持传入渐变配置对象,实现渐变效果,示例:
<!DOCTYPE html>
<html lang="zh-CN">
	<head>
		<meta charset="utf-8" />
		<meta http-equiv="X-UA-Compatible" content="IE=edge" />
		<meta name="viewport" content="width=device-width,initial-scale=1.0" />
		<title>Echarts Example</title>
	</head>
	<body>
		<div id="main" style="width: 600px;height: 400px"></div>

		<script src="//cdn.bootcss.com/echarts/4.5.0/echarts.common.js"></script>
		<script type="text/javascript"> var myChart = echarts.init(document.getElementById('main')); var option = { toolbox: { feature: { saveAsImage: {}, }, }, xAxis: { type: 'category', data: ['Mon', 'Tue', 'Wed', 'Thu', 'Fri', 'Sat', 'Sun'], }, yAxis: { type: 'value' }, series: [ { data: [820, 932, 901, 934, 1290, 1330, 1320], type: 'line', boundaryGap: false, areaStyle: { // 传入渐变对象实例 color: new echarts.graphic.LinearGradient(0, 0, 0, 1, [ { offset: 0, color: 'rgb(0, 255, 102)', }, { offset: 1, color: 'rgb(0, 102, 102)', }, ]), }, }, ], }; myChart.setOption(option); </script>
	</body>
</html>
示例效果:
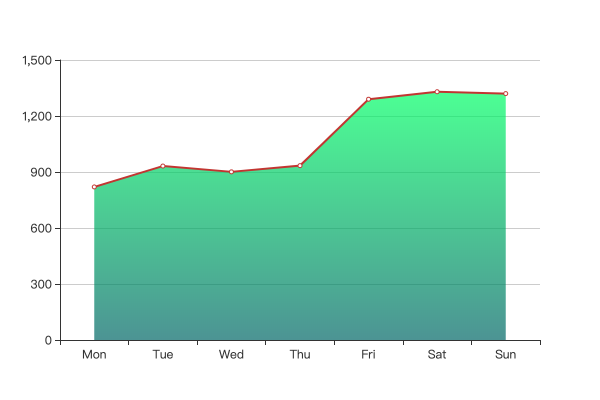
渐变效果可通过线性渐变类 echarts.graphic.LinearGradient、径向渐变类 echarts.graphic.RadialGradient 声明。
color 属性还支持传入 HTMLImageElement 对象,实现背景图像配置,示例:
<!DOCTYPE html>
<html lang="zh-CN">
	<head>
		<meta charset="utf-8" />
		<meta http-equiv="X-UA-Compatible" content="IE=edge" />
		<meta name="viewport" content="width=device-width,initial-scale=1.0" />
		<title>Echarts Example</title>
	</head>
	<body>
		<img id="img" src="../assets/imooc-logo.png" alt="" style="width: 0;" />
		<div id="main" style="width: 600px;height: 400px"></div>

		<script src="//cdn.bootcss.com/echarts/4.5.0/echarts.common.js"></script>
		<script type="text/javascript"> var myChart = echarts.init(document.getElementById('main')); var option = { toolbox: { feature: { saveAsImage: {}, }, }, xAxis: { type: 'category', data: ['Mon', 'Tue', 'Wed', 'Thu', 'Fri', 'Sat', 'Sun'], }, yAxis: { type: 'value' }, series: [ { data: [820, 932, 901, 934, 1290, 1330, 1320], type: 'line', boundaryGap: false, areaStyle: { color: { image: document.getElementById('img'), repeat: 'repeat' }, }, }, ], }; myChart.setOption(option); </script>
	</body>
</html>
示例效果:
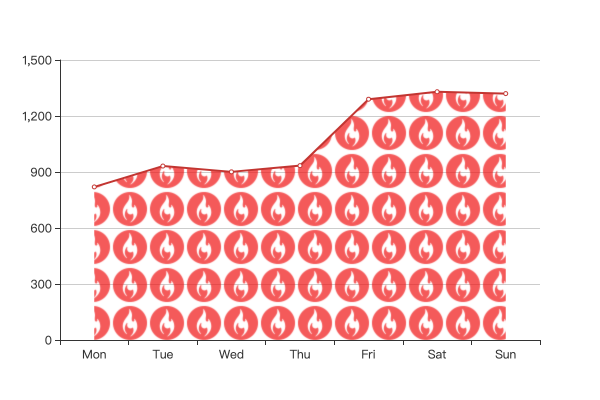
上例 color 对象接受两个配置属性:
document.getElementById 等方法获取到 dom 实例;no-repeat、repeat-x、repeat-y、repeat除上述情况外,部分特殊组件的 areaStyle.color 属性还支持传入数组,配置多个背景。例如直角坐标轴组件的 xAxis.splitArea.areaStyle.color,示例:
<!DOCTYPE html>
<html lang="zh-CN">
<head>
<meta charset="utf-8" />
<meta http-equiv="X-UA-Compatible" content="IE=edge" />
<meta name="viewport" content="width=device-width,initial-scale=1.0" />
<title>Echarts Example</title>
</head>
<body>
<img id="img" src="../assets/imooc-logo.png" alt="" style="width: 0;" />
<div id="main" style="width: 600px;height: 400px"></div>
<script src="//cdn.bootcss.com/echarts/4.5.0/echarts.common.js"></script>
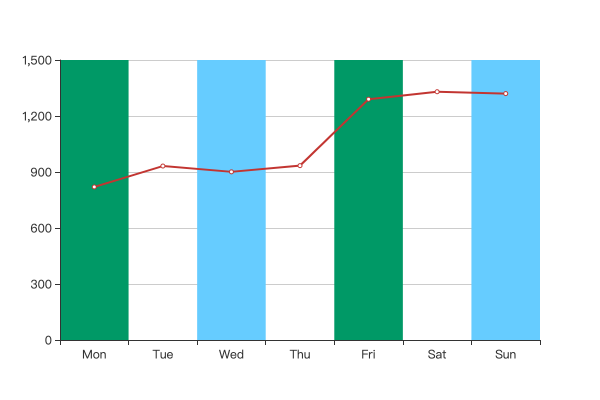
<script type="text/javascript"> var myChart = echarts.init(document.getElementById('main')); var option = { toolbox: { feature: { saveAsImage: {}, }, }, xAxis: { type: 'category', data: ['Mon', 'Tue', 'Wed', 'Thu', 'Fri', 'Sat', 'Sun'], splitArea: { show: true, areaStyle: { color: ['#009966', 'transparent', '#66CCFF', 'transparent'], }, }, }, yAxis: { type: 'value' }, series: [ { data: [820, 932, 901, 934, 1290, 1330, 1320], type: 'line', }, ], }; myChart.setOption(option); </script>
</body>
</html>
示例效果:
支持复数背景色配置的组件汇总如下:

本节主要讨论区域样式的配置方法,所谓“区域样式”是各类图表中广泛存在的功能特性,学习时应助理理解 color 属性所能支持的各类效果,包括单色值、多色值、渐变、图像对象四种场景,在实际应用中需要灵活调用。
另外,本文讨论的是 areaStyle 的基类,也就是最基础的功能集。各个组件在继承、实现时会因组件的特性而略有变化,所以实际应用中可查阅配置文档,根据文档的说明进行开发。