-
未登录
热门文章
通过前面的学习,我们发现我们可以创建一个几乎完美的图表,但是做到如此 ECharts 还是觉得远远不够,他认为一个好的图表不仅要能完美的展示数据,还应该有一些附加的功能帮助用户更好的更方便的完成一些其他的事情,比如:导出图片,动态切换图表类型等等。这些功能在 ECharts 的工具栏组件都能完成,让我们看一下吧。
ECharts 的工具栏组件在主要的图表功能之外,为用户提供了图片导出、数据视图切换、图表类型切换、数据区域缩放、还原、数据框选六类功能按钮。
工具栏组件可通过 toolbox 属性进行配置,形如:
const options = {
	toolbox: {
		show: true,
		feature: {},
		...
	}
};
完整的配置项列表请参考 官网,其中 feature 用于配置工具栏的功能按钮,支持如下子属性:
feature.saveAsImage: “图片导出”功能配置,特别的可通过该项设定导出图片的格式、分辨率、需要忽略的组件等;feature.store: “还原”功能配置,可通过该项设定工具按钮视觉效果;feature.dataView: “数据视图切换”功能配置,特别的可通过该项定义从数据视图到配置项,或从配置项到数据视图的转换函数;feature.dataZoom: “数据区域缩放”功能配置,特别的可通过该项设定数据缩放时的过滤效果;feature.magicType: “图表类型切换”功能配置,特别的可通过该项设定支持切换的类型、切换时附加的配置项等;feature.brush: “数据框选”功能配置,可用于设定按钮视觉效果。下面展开讨论。
工具栏组件的“图片导出”按钮可将图表导出为静态图片,支持 jpeg、png、svg 三种格式,可通过 toolbox.feature.saveAsImage 项进行配置,其中比较重要的配置项有:
renderer = canvas 时,支持 jpeg、png,默认为 png;当 renderer = svg 时仅支持 svg 格式;title.text 值;例如对于下述配置:
<!DOCTYPE html>
<html lang="zh-CN">
<head>
<meta charset="utf-8" />
<meta http-equiv="X-UA-Compatible" content="IE=edge" />
<meta name="viewport" content="width=device-width,initial-scale=1.0" />
<title>Echarts Example</title>
</head>
<body>
<div id="main" style="width: 600px; height: 400px;"></div>
<script src="//cdn.bootcss.com/echarts/4.5.0/echarts.js"></script>
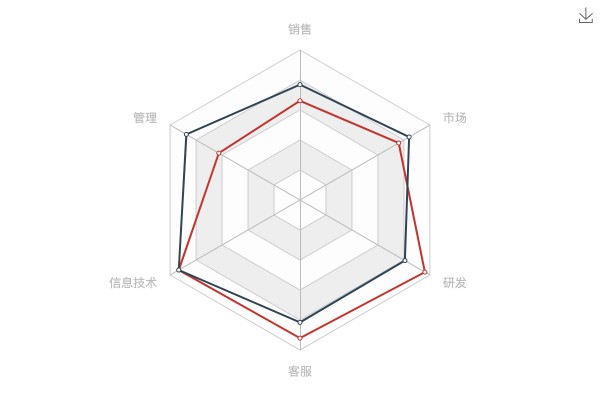
<script type="text/javascript"> const myChart = echarts.init(document.getElementById('main')); const option = { toolbox: { feature: { saveAsImage: { pixelRatio: 1, type: 'jpeg', excludeComponents: ['legend'] } }, }, legend: { data: ['预算', '实际开销'], left: 0, }, radar: { indicator: [ { name: '销售', max: 6500 }, { name: '管理', max: 16000 }, { name: '信息技术', max: 30000 }, { name: '客服', max: 38000 }, { name: '研发', max: 52000 }, { name: '市场', max: 25000 }, ], }, series: [ { type: 'radar', data: [ { value: [4300, 10000, 28000, 35000, 50000, 19000], name: '预算', }, { value: [5000, 14000, 28000, 31000, 42000, 21000], name: '实际开销', }, ], }, ], }; myChart.setOption(option); </script>
</body>
</html>
导出效果:

Tips:
pixelRatio 定义导出图片的缩放比例,例如上例中图表容器的宽高为style="width: 600px; height: 400px;",若pixelRatio = 1则导出图片分辨率为 600x400;若pixelRatio = 2则为 1200x800;若pixelRatio = 0.5则为 300x200。下限为 0,当数值超过 35 时,导出图片可能为空。
除工具栏按钮外,开发者还可以通过 echartsInstance.getDataURL 接口将图表内容导出为 base64 串,该接口接受如下参数:
(opts: {
	// 导出的格式,可选 png, jpeg, svg
	type?: string,
	// 导出的图片分辨率比例,默认为 1。
	pixelRatio?: number,
	// 导出的图片背景色,默认使用 option 里的 backgroundColor
	backgroundColor?: string,
	// 忽略组件的列表
	excludeComponents?: Array<string>,
}) => string;
结合 getDataURL 接口,下述代码片段同样可实现导出为本地图片文件功能:
function saveAsImg(chart) {
	const img = chart.getDataURL({
		backgroundColor: '#fff',
		excludeComponents: ['legend'],
		pixelRatio: 1,
	});
	const anchor = document.createElement('a');
	anchor.href = img;
	anchor.setAttribute('download', 'test.jpeg');
	anchor.click();
}
导出效果:
导出功能对 bmap 插件失效,无法导出百度地图层。
数据视图工具用于修改数据视图,通过 toolbox.feature.dataView 项配置,点击后可以以表格形式展示图表中包含的数据信息;表格本身还支持简单编辑功能,编辑后会即时更新图表视图。例如:
<!DOCTYPE html>
<html lang="zh-CN">
	<head>
		<meta charset="utf-8" />
		<meta http-equiv="X-UA-Compatible" content="IE=edge" />
		<meta name="viewport" content="width=device-width,initial-scale=1.0" />
		<title>Echarts Example</title>
	</head>
	<body>
		<div id="main" style="width: 600px; height: 400px;"></div>

		<script src="//cdn.bootcss.com/echarts/4.5.0/echarts.js"></script>
		<script type="text/javascript"> const myChart = echarts.init(document.getElementById('main')); const option = { toolbox: { feature: { // 提供 dataView 空对象即可启动 dataView 功能 dataView: {}, }, }, radar: { indicator: [ { name: '销售', max: 6500 }, { name: '管理', max: 16000 }, { name: '信息技术', max: 30000 }, { name: '客服', max: 38000 }, { name: '研发', max: 52000 }, { name: '市场', max: 25000 }, ], }, series: [ { type: 'radar', data: [ { value: [4300, 10000, 28000, 35000, 50000, 19000], name: '预算', }, { value: [5000, 14000, 28000, 31000, 42000, 21000], name: '实际开销', }, ], }, ], }; myChart.setOption(option); </script>
	</body>
</html>
示例效果:

toolbox.feature.dataView 有两个比较重要的配置项:
(option:Object) => HTMLDomElement|string;通过这两个函数,可以做出许多复杂绚丽的效果,例如使用 react 渲染数据视图:
<!DOCTYPE html>
<html lang="zh-CN">
	<head>
		<meta charset="utf-8" />
		<meta http-equiv="X-UA-Compatible" content="IE=edge" />
		<meta name="viewport" content="width=device-width,initial-scale=1.0" />
		<title>Echarts Example</title>
	</head>
	<body>
		<div id="main" style="width: 600px; height: 400px;"></div>
		<div id="dataview">hello world</div>

		<script src="//cdn.bootcss.com/echarts/4.5.0/echarts.js"></script>
		<script crossorigin src="//unpkg.com/react@16/umd/react.production.min.js"></script>
		<script crossorigin src="//unpkg.com/react-dom@16/umd/react-dom.production.min.js"></script>
		<script type="text/javascript"> const myChart = echarts.init(document.getElementById('main')); // 使用react组件形式编写的数据视图 function DataView(props) { const rows = props.series; return React.createElement( 'table', { className: 'table', }, rows.map(function (row) { return React.createElement( 'tr', null, React.createElement('td', null, row.name), row.value.map(function (cell) { return React.createElement('td', null, cell); }) ); }) ); } const option = { toolbox: { feature: { dataView: { optionToContent(opt) { const { series: [{ data }], } = opt; // 动态创建一个容器节点 const root = document.createElement('div'); // 需要先将react组件渲染到容器节点上 ReactDOM.render(React.createElement(DataView, { series: data }), root); return root; }, }, }, }, radar: { indicator: [ { name: '销售', max: 6500 }, { name: '管理', max: 16000 }, { name: '信息技术', max: 30000 }, { name: '客服', max: 38000 }, { name: '研发', max: 52000 }, { name: '市场', max: 25000 }, ], }, series: [ { type: 'radar', data: [ { value: [4300, 10000, 28000, 35000, 50000, 19000], name: '预算', }, { value: [5000, 14000, 28000, 31000, 42000, 21000], name: '实际开销', }, ], }, ], }; myChart.setOption(option); </script>
	</body>
</html>
Tips:
- 若 optionToContent 返回的是页面中已经存在 DOM 元素时,ECharts 会将该元素剪切到数据视图中,这以为着原来位置会丢失这部分 DOM!例如对于
optionToContent: document.getElementById('dataview'),一旦执行数据视图功能,原来位置上的 dataview 元素将会被删除。- 数据视图工具只对使用
series.data配置数据的方式有效,不能应用在 dataset 上。
图表类型切换工具允许用户在运行状态下动态变更图表类型,目前支持在 line、bar 两种图表间切换;以及在 stack(堆叠)、tiled(平铺) 两种状态间切换。动态类型工具可通过 toolbox.feature.magicType 项进行配置,核心配置项有:
下面示例综合体现上述配置项的用法:
<!DOCTYPE html>
<html lang="zh-CN">
	<head>
		<meta charset="utf-8" />
		<meta http-equiv="X-UA-Compatible" content="IE=edge" />
		<meta name="viewport" content="width=device-width,initial-scale=1.0" />
		<title>Echarts Example</title>
	</head>
	<body>
		<div id="main" style="width: 600px; height: 400px;"></div>

		<script src="//cdn.bootcss.com/echarts/4.5.0/echarts.js"></script>
		<script type="text/javascript"> const myChart = echarts.init(document.getElementById('main')); const option = { toolbox: { feature: { magicType: { type: ['line', 'bar', 'stack', 'tiled'], option: { // 类型切换时,下述配置项将被merge到对应类型的图表 series 中 line: { smooth: true }, bar: { label: { show: true } }, stack: { label: { show: true, color: 'red' } }, }, seriesIndex: { line: [0], }, }, }, }, xAxis: { type: 'category', boundaryGap: false, data: ['周一', '周二', '周三', '周四', '周五', '周六', '周日'], }, yAxis: { type: 'value', axisLabel: { formatter: '{value} °C', }, }, series: [ { name: '最高气温', type: 'line', data: [11, 11, 15, 13, 12, 13, 10], }, { name: '最低气温', type: 'line', data: [1, -2, 2, 5, 3, 2, 0], }, ], }; myChart.setOption(option); </script>
	</body>
</html>
示例效果:

Tips:
类型切换功能可能会带入一些副作用,例如上例中从 bar 切换到 line 时,第一个序列的颜色发生了变化。
缩放工具基于 datazoom 组件实现,配置上有两个重点,一是通过 xAxisIndex 或 yAxisIndex 指定缩放工具作用的轴;二是通过 filterMode 设定数值的过滤逻辑。两类配置的详细介绍可参考 datazoom 一节,此处不再赘述。
用户通过数据视图工具或数据区域缩放工具修改图表状态后,可使用重置按钮设置回初始状态。重置功能的配置属性比较简单,均用于修改图标样式,请直接查阅官网,此处不赘述。
Tips:
重置功能有很多限制:
- 只适用于通过数据视图工具、数据区域缩放工具两类操作造成的影响,其他更新操作,如 appendData、setOption 接口触发的变更都不在此列。
- 没有历史堆栈功能,执行重置后只会回到初始状态。例如,如果多次使用数据视图工具修改数据值,虽然按理说已经产生了多个中间态,但一旦重置,只能回到最开始传入的配置状态。

本节结合多个实例,讲述 Echarts 工具栏组件(toolbox)的各类应用方法,包括导出图片、数据视频、图表类型切换、区域缩放、重置等功能项的用法及注意事项。