-
未登录
热门文章
在一个数据图表中,可能由于数据所表示的时间范围较大,从而导致整个图表相当的长,当这些数据都不得不展示的时候,对我们分析某一段时间内数据的变化造成的极大的影响,所以当我们遇到这种情况的时候就需要用到 ECharts 的数据缩放组件了。
dataZoom 组件 用于区域缩放,从而能自由关注细节的数据信息,或者概览数据整体,或者去除离群点的影响。
xx解释
dataZoom 组件提供了一套在图表运行状态下,终端用户可以通过鼠标、手指(触屏下)的动作触发图表视图窗口变化,使图表聚焦在某个局部区域的交互功能。dataZoom 有 3 个变种:
原理上,dataZoom 通过控制坐标轴的数值范围实现图表视图窗口的变化,所以对于开发者来说,无论使用变种,最基本的需要确定 dataZoom 控制的是那个(或那些)数轴,以及对其他数轴的影响。
Tips:
dataZoom 只适用于直角坐标系、极坐标系,对于地图、日历坐标系等可考虑使用 visualmap 组件。
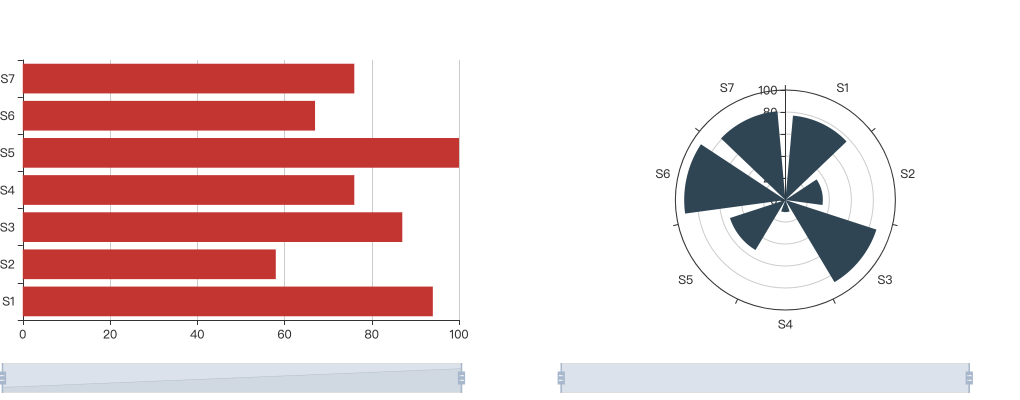
使用 dataZoom 的第一步是确定缩放组件要控制那一条坐标轴,方法很简单,在直角坐标系下通过设定 xAxisIndex或 yAxisIndex 为对应坐标轴下标;极坐标系下通过设定 radiusAxisIndex 或 angleAxisIndex 为对应坐标轴下标即可。例如下例设定两个 dataZoom 实例并分别指向两个不同类型的坐标轴:
<!DOCTYPE html>
<html lang="zh-CN">
	<head>
		<meta charset="utf-8" />
		<meta http-equiv="X-UA-Compatible" content="IE=edge" />
		<meta name="viewport" content="width=device-width,initial-scale=1.0" />
		<title>Echarts Example</title>
	</head>
	<body>
		<div id="main" style="width: 1020px; height: 400px;"></div>

		<script src="//cdn.bootcss.com/echarts/4.5.0/echarts.js"></script>
		<script type="text/javascript"> const random = (min, max) => Math.round(Math.random() * (max - min) + min); const myChart = echarts.init(document.getElementById('main')); const option = { toolbox: { feature: { saveAsImage: {}, }, }, dataZoom: [ // 作用在直角坐标系上 { type: 'slider', xAxisIndex: 0, right: '55%', left: 0 }, // 作用在极坐标系上 { type: 'slider', angleAxisIndex: 0, left: '55%', right: '5%' }, ], grid: { left: 0, containLabel: true, width: '45%' }, xAxis: { type: 'value' }, yAxis: { type: 'category' }, polar: { left: '50%', containLabel: true, radius: '55%', center: ['77%', '50%'] }, angleAxis: { type: 'category' }, radiusAxis: { type: 'value' }, series: [ { data: genSeriesData(7), type: 'bar', }, { data: genSeriesData(7), type: 'bar', coordinateSystem: 'polar', }, ], }; myChart.setOption(option); function genSeriesData(len) { const result = []; for (let i = 0; i < len; i += 1) { const node = [random(10, 100), `S${i + 1}`]; result.push(node); } return result; } </script>
	</body>
</html>
示例效果:
Tips:
dataZoom 三个变种功能相似,其中只有 slider 类型提供了视觉组件,为演示的便利,本文中的示例默认使用 slider 类型,inside、select 功能类似,以此类推即可。
dataZoom 也支持同时控制两条轴的数据窗口,只需同时指定 xAxisIndex 和 yAxisIndex(极坐标下则同时指定 angleAxisIndex、radiusAxisIndex),不过需要两个轴有相同的类型和数值范围,例如下例:
<!DOCTYPE html>
<html lang="zh-CN">
	<head>
		<meta charset="utf-8" />
		<meta http-equiv="X-UA-Compatible" content="IE=edge" />
		<meta name="viewport" content="width=device-width,initial-scale=1.0" />
		<title>Echarts Example</title>
	</head>
	<body>
		<div id="main" style="width: 1020px; height: 400px;"></div>

		<script src="//cdn.bootcss.com/echarts/4.5.0/echarts.js"></script>
		<script type="text/javascript"> const random = (min, max) => Math.round(Math.random() * (max - min) + min); const myChart = echarts.init(document.getElementById('main')); const option = { // 同时控制x轴、y轴 dataZoom: [{ type: 'slider', xAxisIndex: 0, yAxisIndex: 0, filterMode: 'weakFilter' }], grid: {}, xAxis: { type: 'value' }, yAxis: { type: 'value' }, tooltip: { trigger: 'axis' }, series: [ { data: genSeriesData(20), type: 'line', smooth: true, areaStyle: {}, }, ], }; myChart.setOption(option); function genSeriesData(len) { const result = []; let cursor = 0; for (let i = 0; i < len; i += 1) { const node = [(cursor = cursor + random(10, 100)), random(100, 1000)]; result.push(node); } return result; } </script>
	</body>
</html>
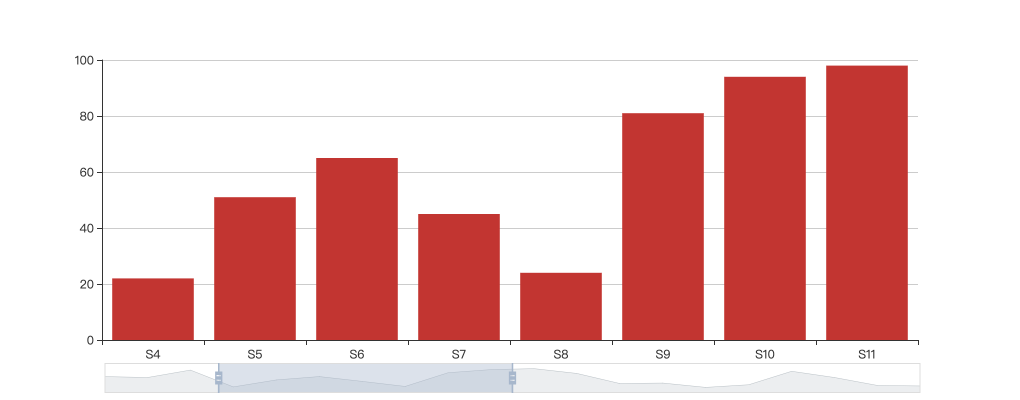
缩放后,要求数值项的 x、y 值同时在窗口内才会显示,可以仔细观察下图,随着 dataZoom 滑块的变化,图表 x、y 轴的数值范围同时发生变化:
选定主轴后,可以通过 filterMode 属性设定 dataZoom 对其它轴及图表数值点的副作用。filterMode 属性支持如下值:
在使用 dataZoom 的场景中,导出图片时会保持经过 dataZoom 调整过的视图窗口,导致图片无法完整地展示整个图表的内容,例如:
<!DOCTYPE html>
<html lang="zh-CN">
	<head>
		<meta charset="utf-8" />
		<meta http-equiv="X-UA-Compatible" content="IE=edge" />
		<meta name="viewport" content="width=device-width,initial-scale=1.0" />
		<title>Echarts Example</title>
	</head>
	<body>
		<div id="main" style="width: 1020px; height: 400px;"></div>
		<button id="export">export png</button>

		<script src="//cdn.bootcss.com/echarts/4.5.0/echarts.js"></script>
		<script type="text/javascript"> const random = (min, max) => Math.round(Math.random() * (max - min) + min); const myChart = echarts.init(document.getElementById('main')); const option = { toolbox: { feature: { saveAsImage: {} } }, dataZoom: [{ type: 'slider', xAxisIndex: 0, start: 14, end: 50 }], grid: {}, xAxis: { type: 'category' }, yAxis: { type: 'value' }, series: [ { data: genSeriesData(20), type: 'bar', }, ], }; myChart.setOption(option); function genSeriesData(len) { const result = []; for (let i = 0; i < len; i += 1) { const node = [`S${i + 1}`, random(10, 100)]; result.push(node); } return result; } </script>
	</body>
</html>
点击右上角工具栏的 saveAsImage 按钮后,导出的结果:
此时,可以综合使用 ECharts 提供的各类接口,自行实现导出过程。基本流程是:
document.createElement('a') 并设置 src 属性为上一步得到图片 base64 值,模拟点击下载行为,得到完整图片;完整示例:
<!DOCTYPE html>
<html lang="zh-CN">
	<head>
		<meta charset="utf-8" />
		<meta http-equiv="X-UA-Compatible" content="IE=edge" />
		<meta name="viewport" content="width=device-width,initial-scale=1.0" />
		<title>Echarts Example</title>
	</head>
	<body>
		<div id="main" style="width: 1020px; height: 400px;"></div>
		<button id="export">export png</button>

		<script src="//cdn.bootcss.com/echarts/4.5.0/echarts.js"></script>
		<script type="text/javascript"> const random = (min, max) => Math.round(Math.random() * (max - min) + min); const myChart = echarts.init(document.getElementById('main')); const option = { toolbox: { feature: { saveAsImage: {} } }, dataZoom: [{ type: 'slider', xAxisIndex: 0, start: 14, end: 50 }], grid: {}, xAxis: { type: 'category' }, yAxis: { type: 'value' }, series: [ { data: genSeriesData(20), type: 'bar', }, ], }; myChart.setOption(option); // 此处实现自定义的图片导出过程 document.getElementById('export').addEventListener('click', () => { const dz = myChart.getModel().option.dataZoom[0]; // 记录当前时刻的偏移值 const oldStart = dz.start; const oldEnd = dz.end; // 通过 action 将dataZoom组件数值范围设置为 0%-100% myChart.dispatchAction({ type: 'dataZoom', start: 0, end: 100 }); // 监听渲染完成事件 myChart.on('finished', download); function download() { const img = myChart.getDataURL({ backgroundColor: '#fff', // 导出时排除 dataZoom 组件 excludeComponents: ['toolbox', 'dataZoom'], pixelRatio: 1, }); const anchor = document.createElement('a'); anchor.href = img; anchor.setAttribute('download', 'test.jpeg'); anchor.click(); // 移除事件监听,避免多次导出 myChart.off('finished', download); myChart.dispatchAction({ type: 'dataZoom', start: oldStart, end: oldEnd }); } }); function genSeriesData(len) { const result = []; for (let i = 0; i < len; i += 1) { const node = [`S${i + 1}`, random(10, 100)]; result.push(node); } return result; } </script>
	</body>
</html>
通过该示例能够正确导出完整图表,结果如:
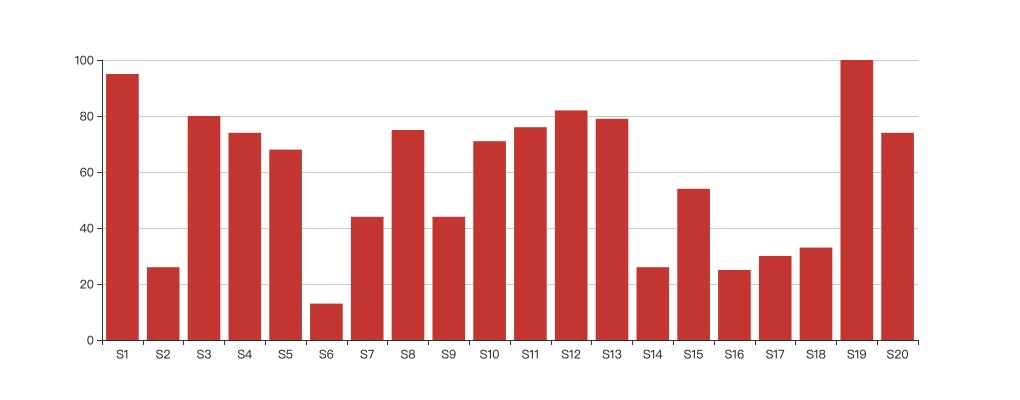
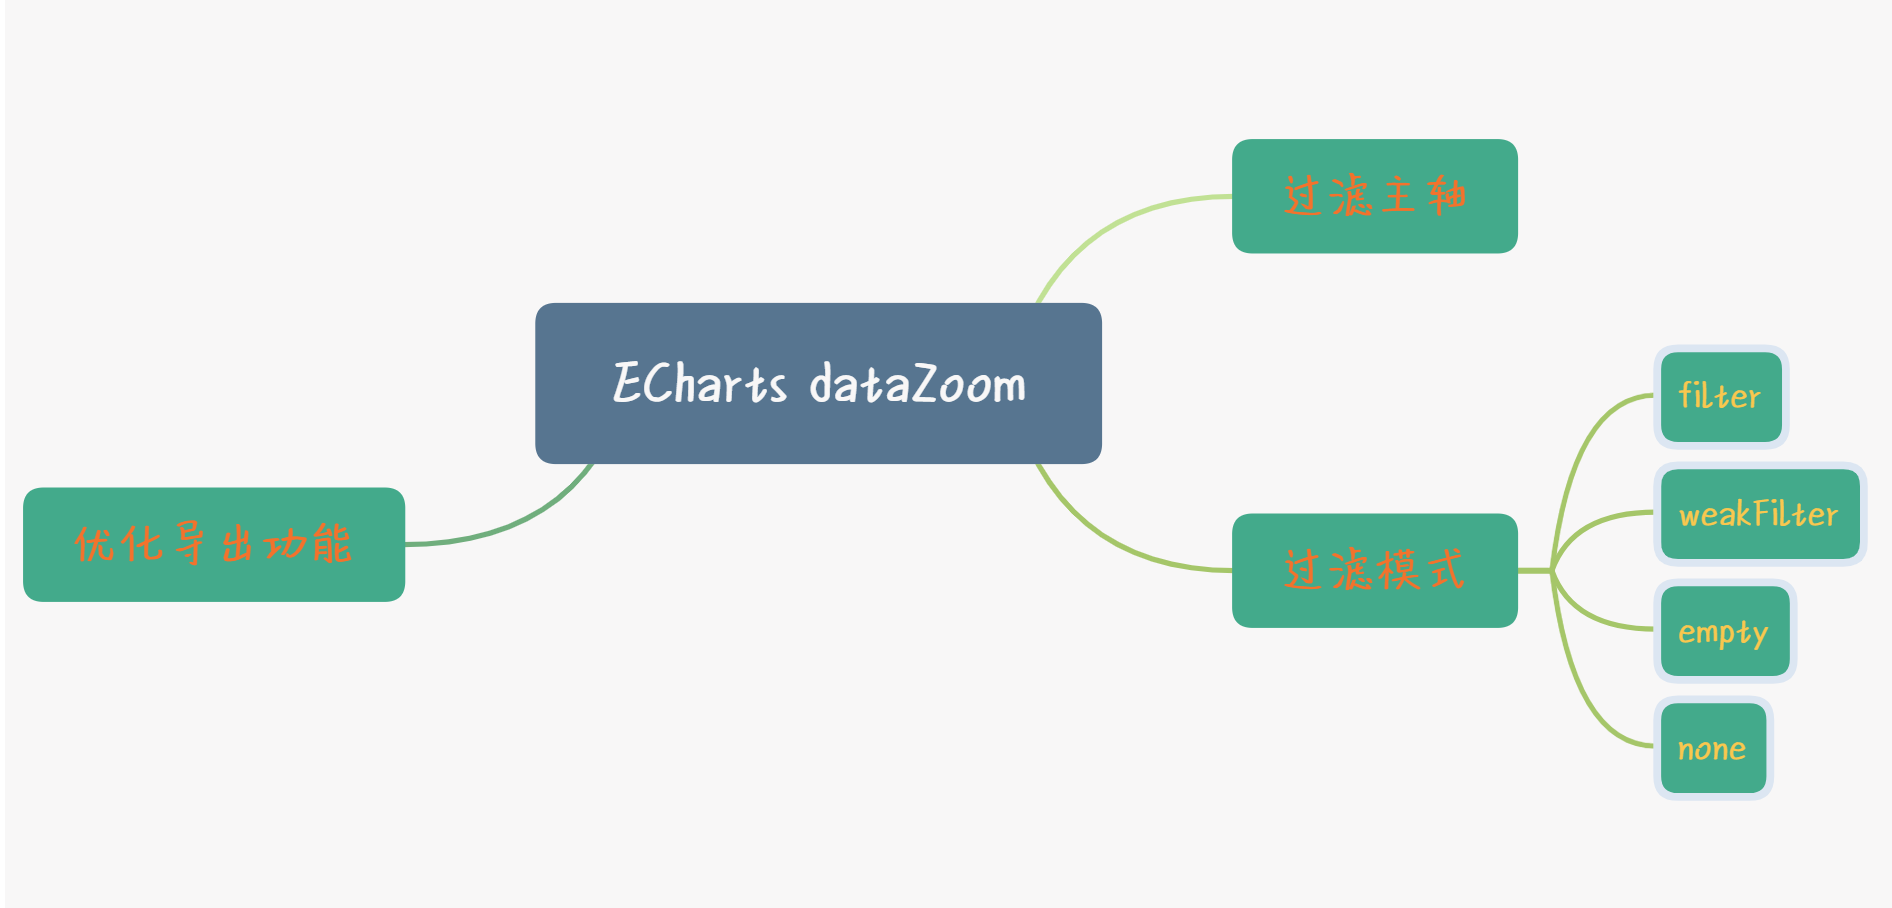
本节结合多个实例,讲述 Echarts 数据缩放组件(dataZoom)的使用方法,包括选定缩放主轴的策略;各类过滤模式的表现;以及在缩放组件介入的场景下,如何完整导出图表。